This dashboard tool allows users to explore weather data for a given location. The data is sourced from OpenWeatherMap.
The top half of the dashboard is for a snapshot of live data, while the bottom half shows four day forecast info.
The user can enter a location into a textbox,
and then explore the weather data for that location.
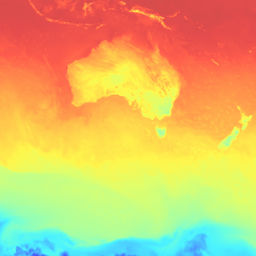
The top right of the weather map has controls for changing the basemap layers, as well as the weather layers.
On the forecast table, a data can be selected to view the forecast charts for that day. The slider below the adjusts the time of day for the forecast table.
Note:
If something seems to be not working correctly, try refreshing the page.
Due to the limitations of the free OpenWeatherMap API, the dashboard is limited to 60 calls per minute. If the dashboard is not working, please wait a minute and try again.
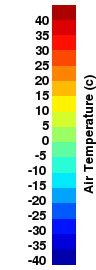
The library used to fetch the weather tile layers had only Celsius legend values available. I chose to keep these, and represent the units of other data values in the dashboard as Fahrenheit.
Methods
Visualization created with Leaflet, D3.js, Billboard.js, Bootstrap, and jQuery. Data fetched from OpenWeatherMap API.